
The latest public Realtor-association data show a Texas housing market with stable statewide prices, stronger sales activity and substantially more buyer choice than during the pandemic-era market. County conditions remain highly localized, with some markets posting renewed sales growth while others are seeing longer marketing periods and greater negotiating leverage.
Statewide Texas snapshot For June 2026:
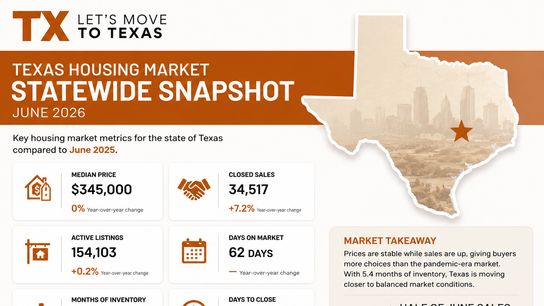
Metric Texas Year-over-year change
Median price $345,000 Flat
Closed sales 34,517 +7.2%
Active listings 154,103 +0.2%
Months of inventory 5.4 months Down from 5.6
Days on market 62 days —
Days to close 34 days —
Total transaction time 96 days 3 days longer
The combination of flat prices and rising sales suggests that buyers are responding when properties are competitively priced. With 5.4 months of inventory, the state is much closer to balanced conditions than it was during the intensely competitive market earlier in the decade.
Approximately half of June sales were below $400,000: 26% were priced from $200,000 to $299,999, while another 23.9% were between $300,000 and $399,999. Only 10.7% of transactions were priced at $750,000 or higher.
Houston region
Greater Houston recorded 8,820 single-family home sales in June, an increase of 3.5% from June 2025. Sales across all property types reached 10,181, up 2.6%, while active listings increased 2.2% to 59,970. Pending sales rose 12.3%, indicating that buyer activity may remain relatively strong in coming months.
Relocation takeaway: Houston-area buyers generally have more properties to compare, but desirable homes in well-connected employment and school districts can still attract meaningful competition.
Central Texas and the Austin area
Across the Unlock MLS Central Texas region, June residential sales increased 0.6% to 2,961. The median price rose 1.1% to $450,000, while active listings fell 14.8% to 13,245. Inventory declined to 4.4 months from 5.4 months one year earlier.
Travis County
• Median price: $542,000, up 4%
• Closed sales: 1,389, up 6.7%
• Active listings: 6,439, down 17.7%
• Inventory: 4.7 months, down 1.4 months
• Pending sales: 1,356, up 16.7%
Travis County tightened noticeably compared with last year. Buyers considering Austin should prepare for greater competition than in surrounding counties, particularly for well-priced homes.
Williamson County
• Median price: $426,800, up 0.5%
• Closed sales: 1,001, up 4.3%
• Active listings: 3,999, down 14%
• Inventory: 3.7 months, down 1.2 months
• Pending sales: 1,037, up 14.5%
Williamson County remains less expensive than Travis County while offering access to major North Austin employment centers. Its lower inventory level indicates comparatively stronger seller conditions.
Hays County
• Median price: $400,000, up 9%
• Closed sales: 390, down 22.8%
• Active listings: 1,819, down 13%
• Inventory: 4.8 months, up 0.5 months
The sharp price increase occurred alongside a large sales decline, which may reflect changes in the types and price ranges of homes sold rather than uniform appreciation across the county.
Bastrop County
• Median price: $344,900, down 6.8%
• Closed sales: 137, up 0.7%
• Active listings: 749, down 5.4%
• Inventory: 6.6 months
Bastrop County offers one of the more buyer-friendly conditions in the Austin orbit, with prices below the regional median and inventory exceeding six months.
Caldwell County
• Median price: $260,495, down 10.2%
• Closed sales: 44, up 12.8%
• Active listings: 239, up 36.6%
• Inventory: 5.6 months
Caldwell County is among the more affordable Central Texas options, although its smaller sales volume means monthly percentages can fluctuate significantly.
San Antonio and Bexar County
Bexar County recorded a median sales price of $310,000, up 1.9% from June 2025. Closed sales declined 1.3% to 2,037, while active inventory increased 2.3% to 10,643 homes. Supply rose from 5.0 to 5.2 months, and days on market declined slightly from 78 to 76 days.
New listings rose 6.6%, but pending sales declined 5.3%, indicating that buyers have additional options and may be moving more selectively.
Relocation takeaway: San Antonio remains considerably less expensive than Austin and many suburban North Texas markets. The combination of moderate inventory and longer marketing periods may give buyers room to request repairs, closing-cost assistance or other concessions.
Comal County
Comal County, which includes New Braunfels and other rapidly growing communities between Austin and San Antonio, reported:
• Median price: $449,000, down 3.1%
• Closed sales: 424, up 40.9%
• Active listings: 2,249, up 6.7%
• Inventory: 7.6 months
• Days on market: 86
• Average close-to-original-list ratio: 93.2%
Comal County’s sales surge occurred despite lower prices and high inventory. With homes closing at an average of 93.2% of their original listing price, buyers appear to have meaningful negotiating leverage.
What relocating buyers should know
Texas is no longer one uniform seller’s market. Statewide pricing is stable, but county-level supply and demand vary sharply.
Austin and Williamson County have tightened, while Bastrop, Caldwell, Bexar and Comal counties generally provide more inventory and greater negotiating potential. Houston continues to post sales growth without a major reduction in available homes.
Buyers should also budget for a longer process. The statewide average now totals approximately 96 days from listing to closing, including 62 days on the market and 34 days to complete the transaction after a contract is accepted.
The strongest opportunities are likely to be found among properties that have remained on the market, received price reductions or are located in counties with more than five to six months of inventory.